Climate Resilience ● Transdisciplinary Research ● Project Management
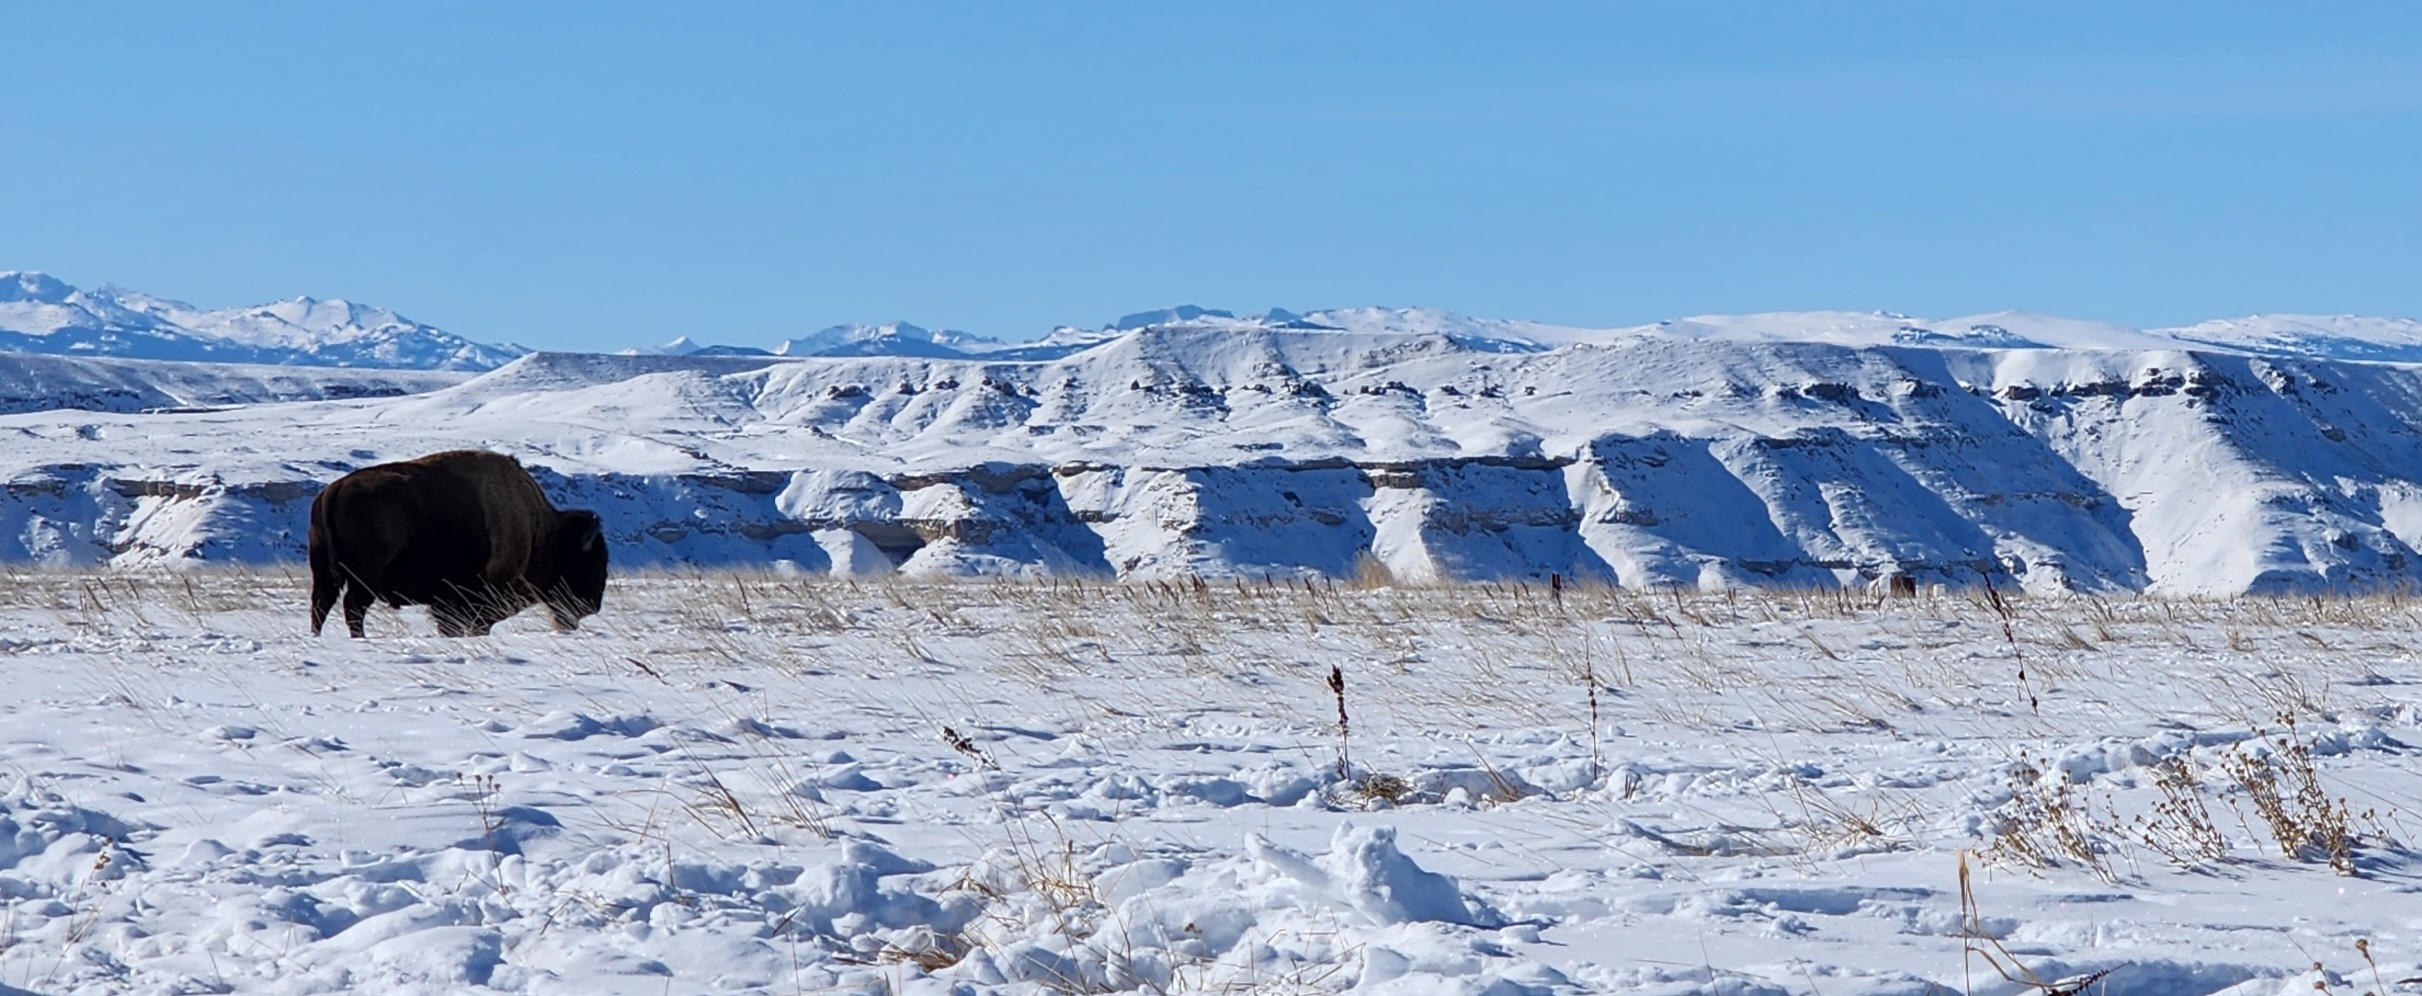
The buffalo was our people’s Walmart. It was their grocery, clothing, and hardware store all in one. — Jason Baldes
Since its inception and over the past six months, the Bison lab has been doing a lot of learning and methodological design. We spent the first couple of months reviewing scientific literature about the ecological impacts of reintroducing bison, with the aim to identify key indicators that could be monitored through satellite remote sensing. Most of the literature we found was based on in situ sampling, but we identified some spectral indices that could be sensitive to the described ecological changes in vegetation species composition, biodiversity, and resilience.
In parallel, we have created a database including the properties’ boundaries (GIS polygons) and the corresponding history of management, and environmental features from the properties managed by the Shoshone tribes and the neighbor properties. We plan to include some plots that currently have bison, some that will have bison in the future, some that are managed for cattle and hay production (“business as usual”), and some plots in preserved areas that do not have any grazing or production. We are now moving to the second phase, which involves carrying out time-series analysis of the spectral indices to compare areas where bison have been reintroduced with control areas under similar conditions without bison or with cattle.
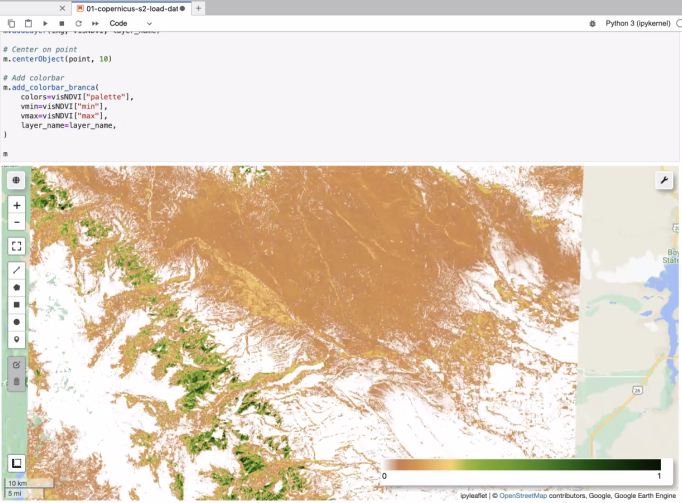
In order to carry out these analyses in a productive way, our team has set up a GitHub repository that utilizes Python and Google Earth Engine to retrieve, process, and model the data, allowing us to generate output data and charts from our areas of interest. Here are a few screenshots that give a general idea of this work.
One big challenge is to match the right control areas with the bison properties so we can make sure to disentangle the effect of the bison reintroduction from other variables. We are currently focusing on getting the right experimental design to be able to answer the scientific questions we have formulated, in a rigorous and unambiguous way.
Once we have all the data extracted from the time series, we will work on the statistical analysis to test whether there are significant differences from the time series such as the timing of the green waves, or the temporal patterns of green indices, that could be explained by an ecological impact on the local species composition, or the vegetation cover.
We have also received the great news of being awarded two separate grants, which will allow us to complement this research with in situ sampling of soil parameters and biodiversity! We will be working in the next couple of weeks to plan these samplings, too.

'Le chêne,' pronounced [leuh-sheh-n' means oak tree in French, my native language.