Strategy ● Interaction Design ● UX Research ● Project Management
Power is the ability to achieve a purpose.
Whether or not it is good or bad depends upon the purpose.
– Dr. Martin Luther King, Jr.
Power mapping is a tool that is used by individuals, institutions, and organizations to identify actors and stakeholders who may be relevant to a campaign. It is an important step for developing a campaign strategy, helping organizers determine where to target their energy to effectively build power.
Many others have used power-mapping before us and numerous methodologies can be found. Our group engaged in a literature review and deepens our knowledge of this framework for building power. We summarize our insights into a textual document. We also being to identify opportunities for contribution.
Power map is an iterative process by which a group defines a goal, and draws a network map to identify a strategy actualizing the goal. This process usually ends in revising the goal, or formulating a new one. And standard power-mapping processes require starting a new map for a new goal, requiring to start from scratch.
Our team became interested in building continuity across these changing goals through a digital tool acting as a strategic companion for teams organizing to build power.
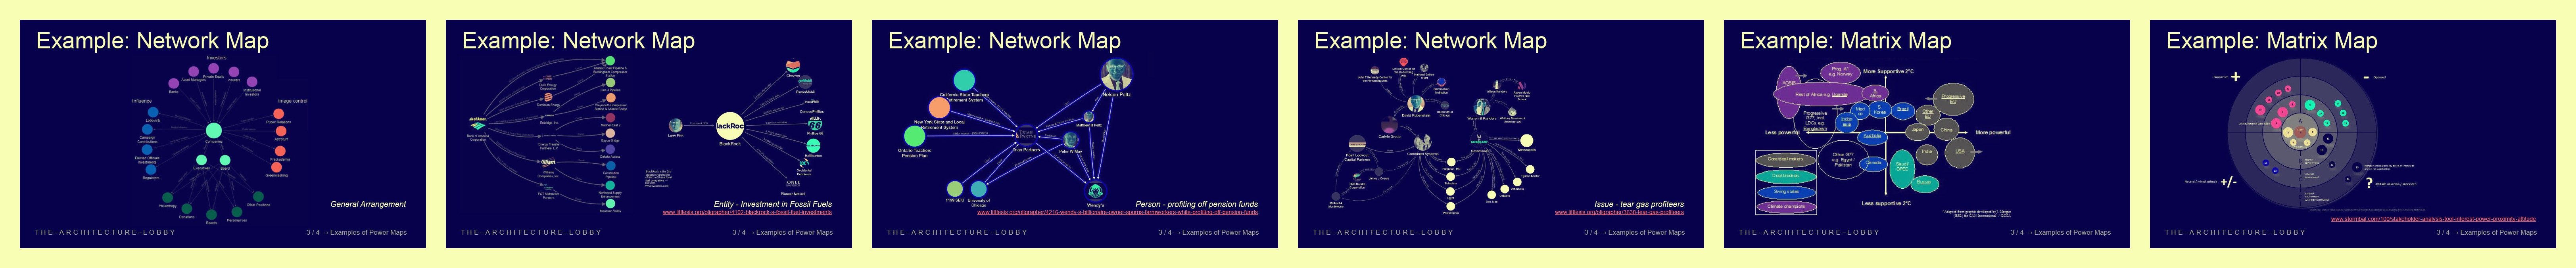
Below are fragments from the document summarizing our literature review findings.
A power map is a tool for understanding existing networks of power, and for building power in service of a particular goal. Power maps play an important role in organizing, as they help to collectively objectify the influence of specific people and groups, allowing organizers to study, discuss, and refine their strategy for impact. But the map can only provide insights. It will be your job to decide what concrete actions to take.
Power maps come in different forms. Some look like a scatter plot graph, while others look more like a mind map or a network visualization. We will provide instructions for creating both of these visualizations; both are important and can be useful for different needs. By visualizing where power lies, we can more easily build alliances and key partnerships while identifying potential opposition.
Each of the campaigns has a set of goals, each of which requires a plan in order to be executed. By mapping existing networks of power, a campaign / working group can more easily understand allies and opposition and make a roadmap for action.
The visualization that’s generated as a result is used to help identify influence:
Alliances are key. Organizers cannot achieve its goals alone. To be effective, we need to organize beyond our membership to form alliances, scale up, and work together toward a common vision. Equally important is a strong understanding of oppositional forces. We must understand what we are up against, and mapping negative influence can anticipate roadblocks and clarify strategy.
The plan must have a clear directive. The process outlined in this guide helps facilitate directed internal discussions that establish priorities, specify objectives, and develop internal clarity.
The conversation you have when making the map is just as important as the map itself. Mapping provides a way of thinking through the problem, identifying patterns and pathways for action. It helps a working group develop clarity of purpose and harnesses the collective toward meaningful and strategic political change while reinforcing grassroots creation of power and solidarity building.
In order to achieve any political goals, we need to build power. There are many different types of power, some of which we are up against, others of which we need to harness. By identifying existing power networks and understanding where we are positioned in them, we can better leverage the power networks themselves, and change them.
In order to test the ways in which a power map can support the elaboration of a communication strategy, we worked through the examples of reforming a processional practice course in an architecture school.
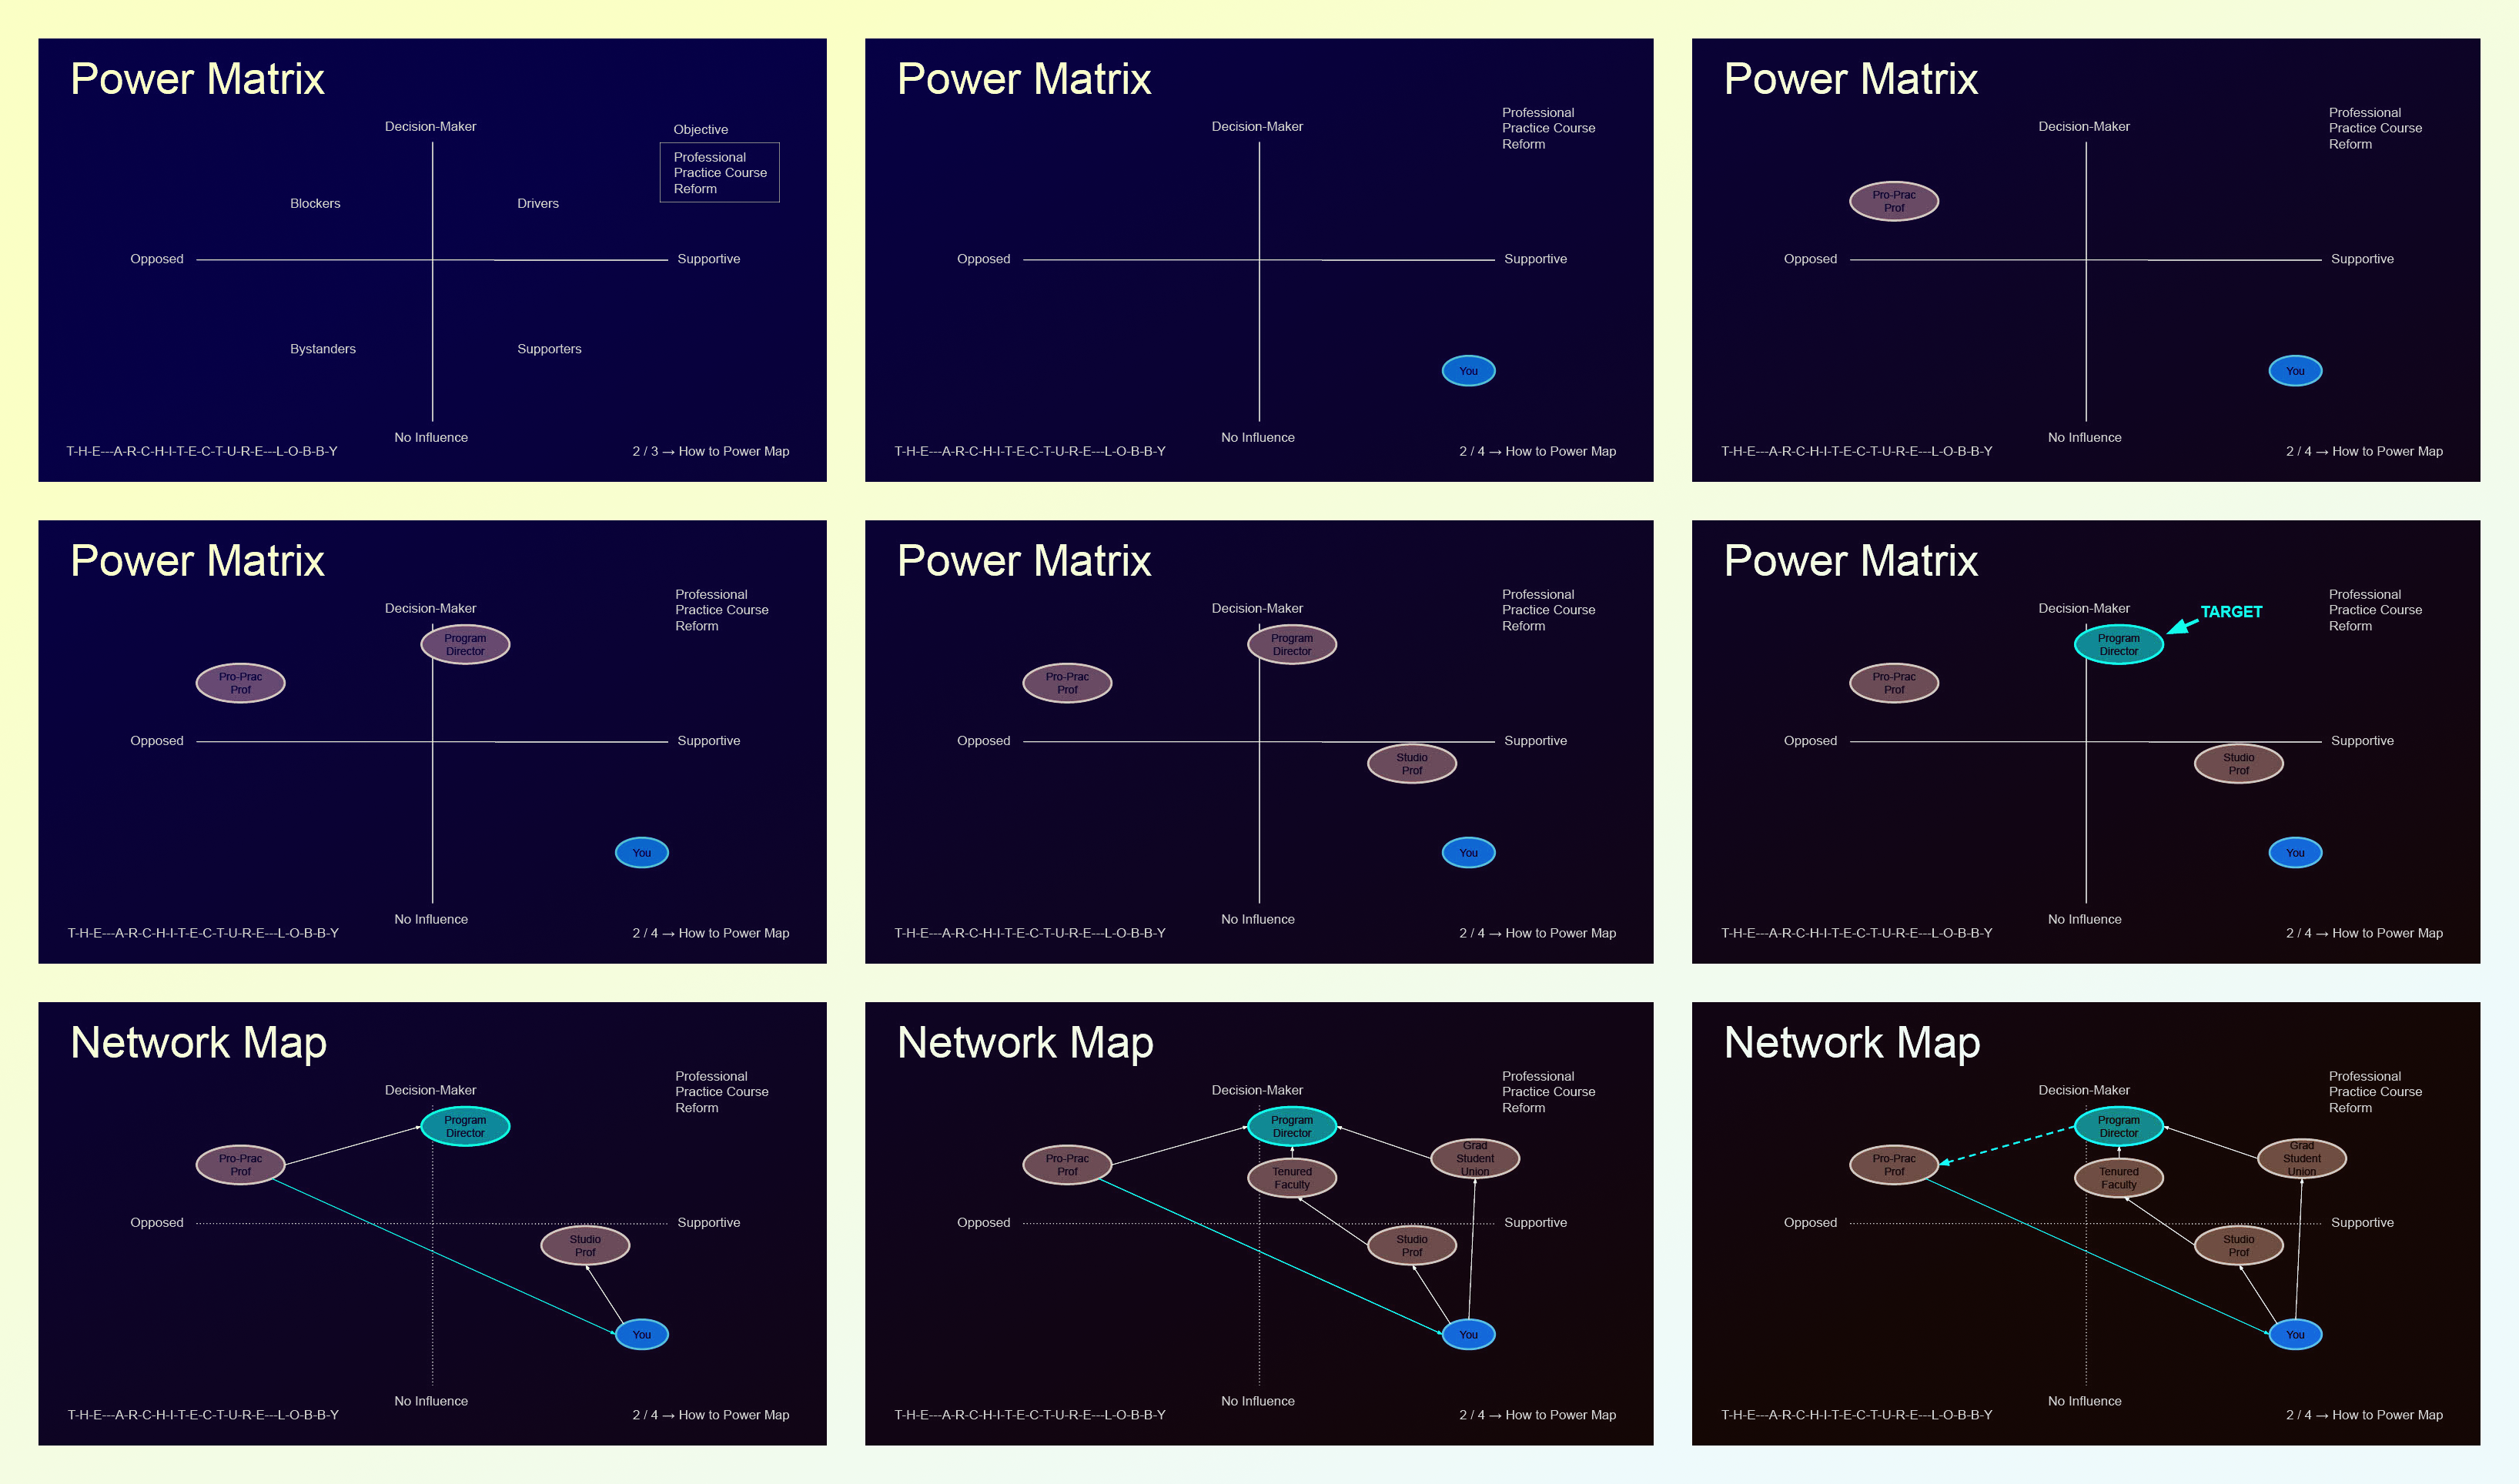
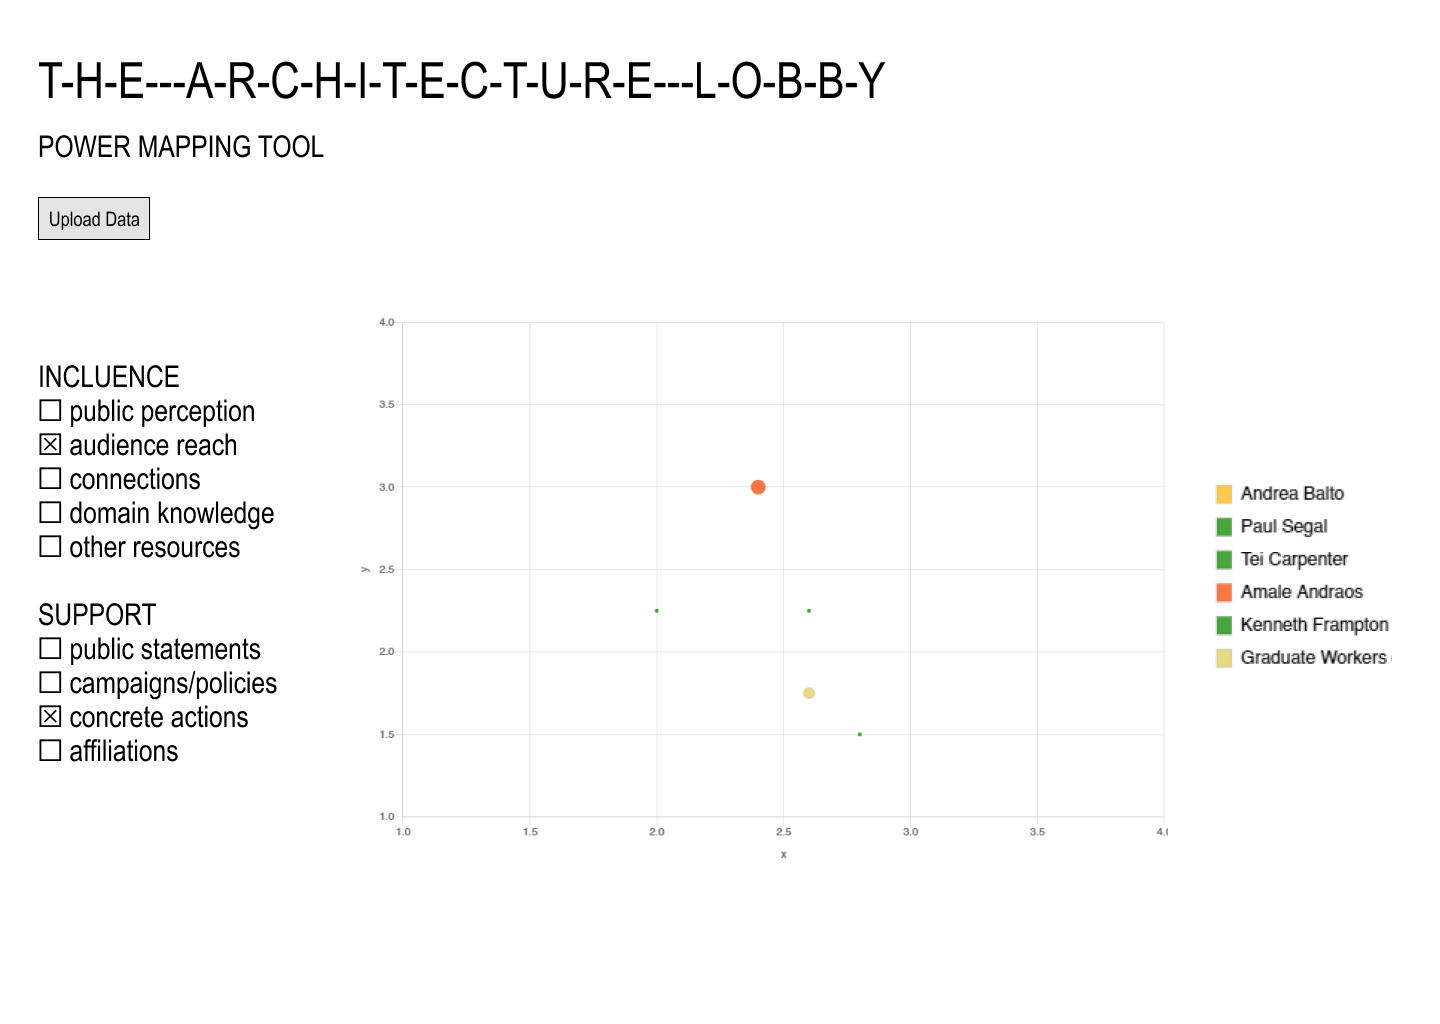
We use a 2x2 matrix framework found in various trusted sources from the literature review to position the power of individuals and their relationship to a specific goal. Out of all the graphic frameworks, this one seemed most structured in its use of space and relational representation since it has clear coordinates defined by two axes. SUPPORT is mapped on the X axis, while INFLUENCE is mapped on the Y axis.
We realized that 2x2 matrices quickly became overwhelmed with information as the research process moved forward.
Power mapping methodologies require moving from mapping stakeholder ("Power Matrix") to defining a strategic pathway through these various nodes ("Network Matrix). A hand drawn matrix quickly becomes impossible to translate as data points accumulate.
We needed a more flexible, interactive, precise method to keep track of insights throughout the planning process.
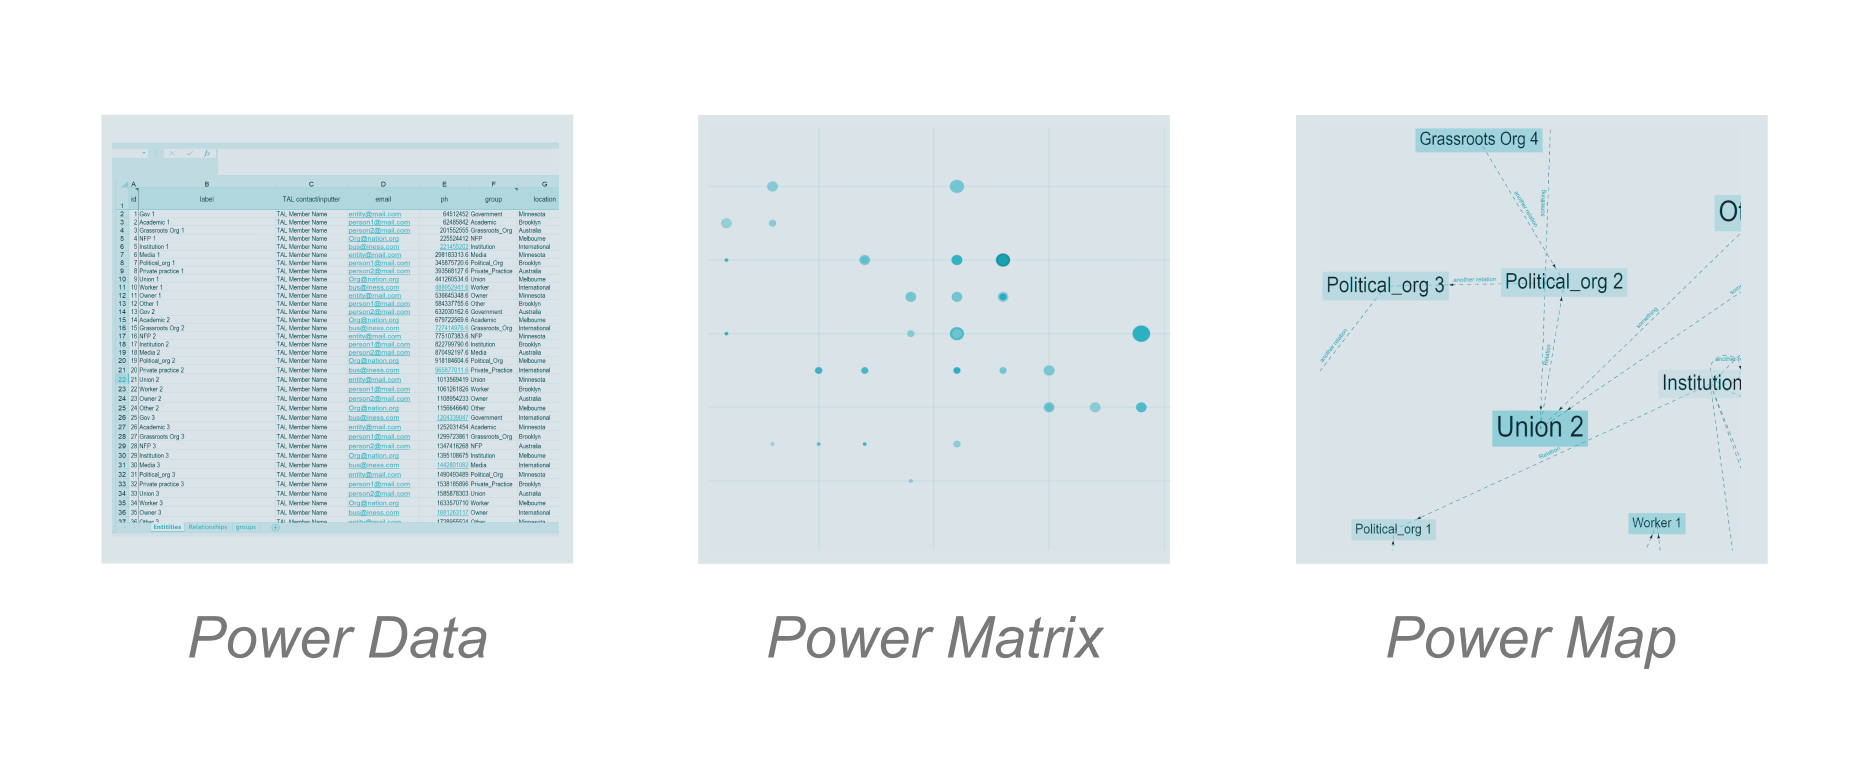
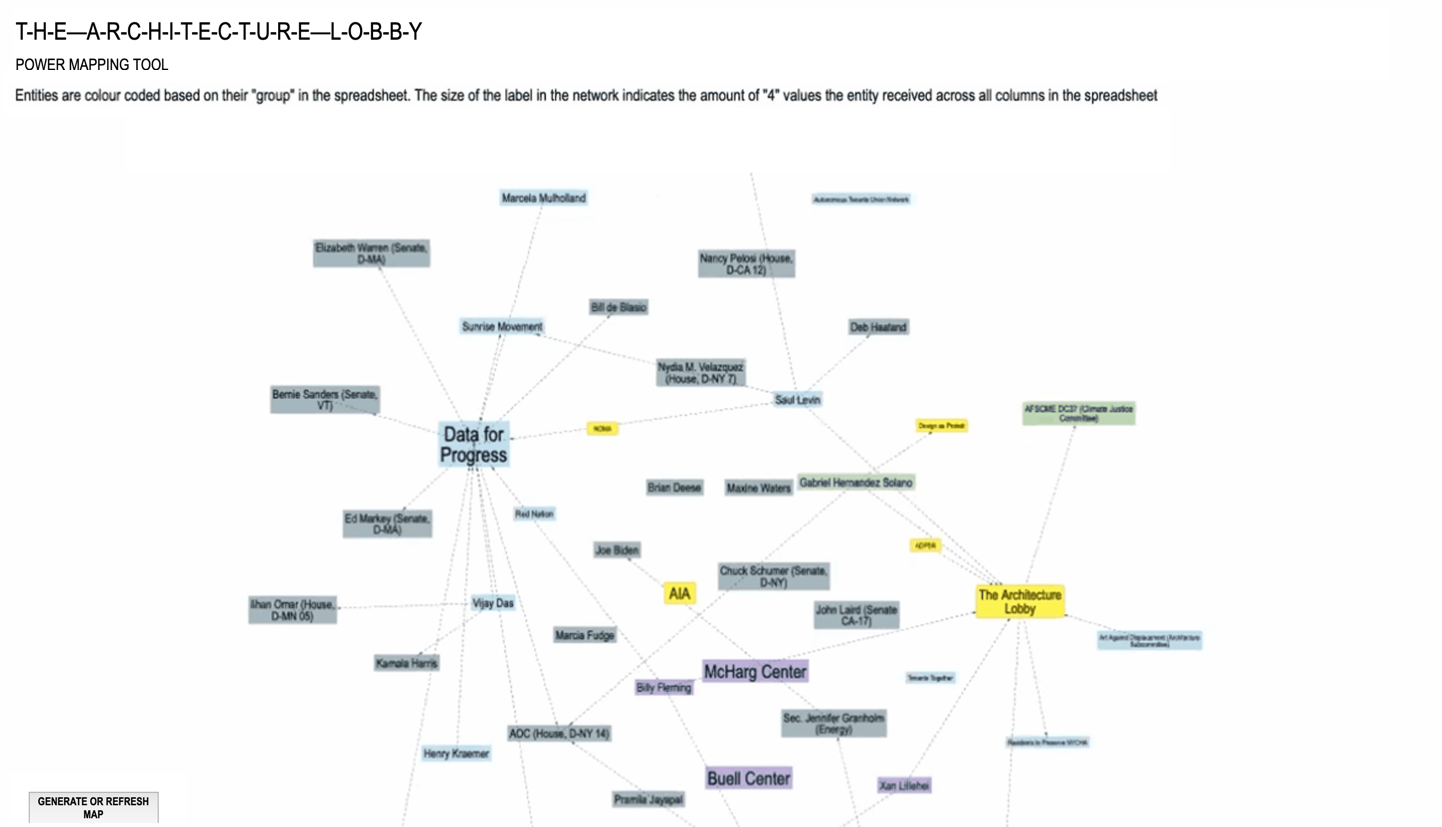
We decided to design an interface allowing to stockpile data through the research process while fostering easy pathways to visualizing key players and possible strategies based on their disposition.
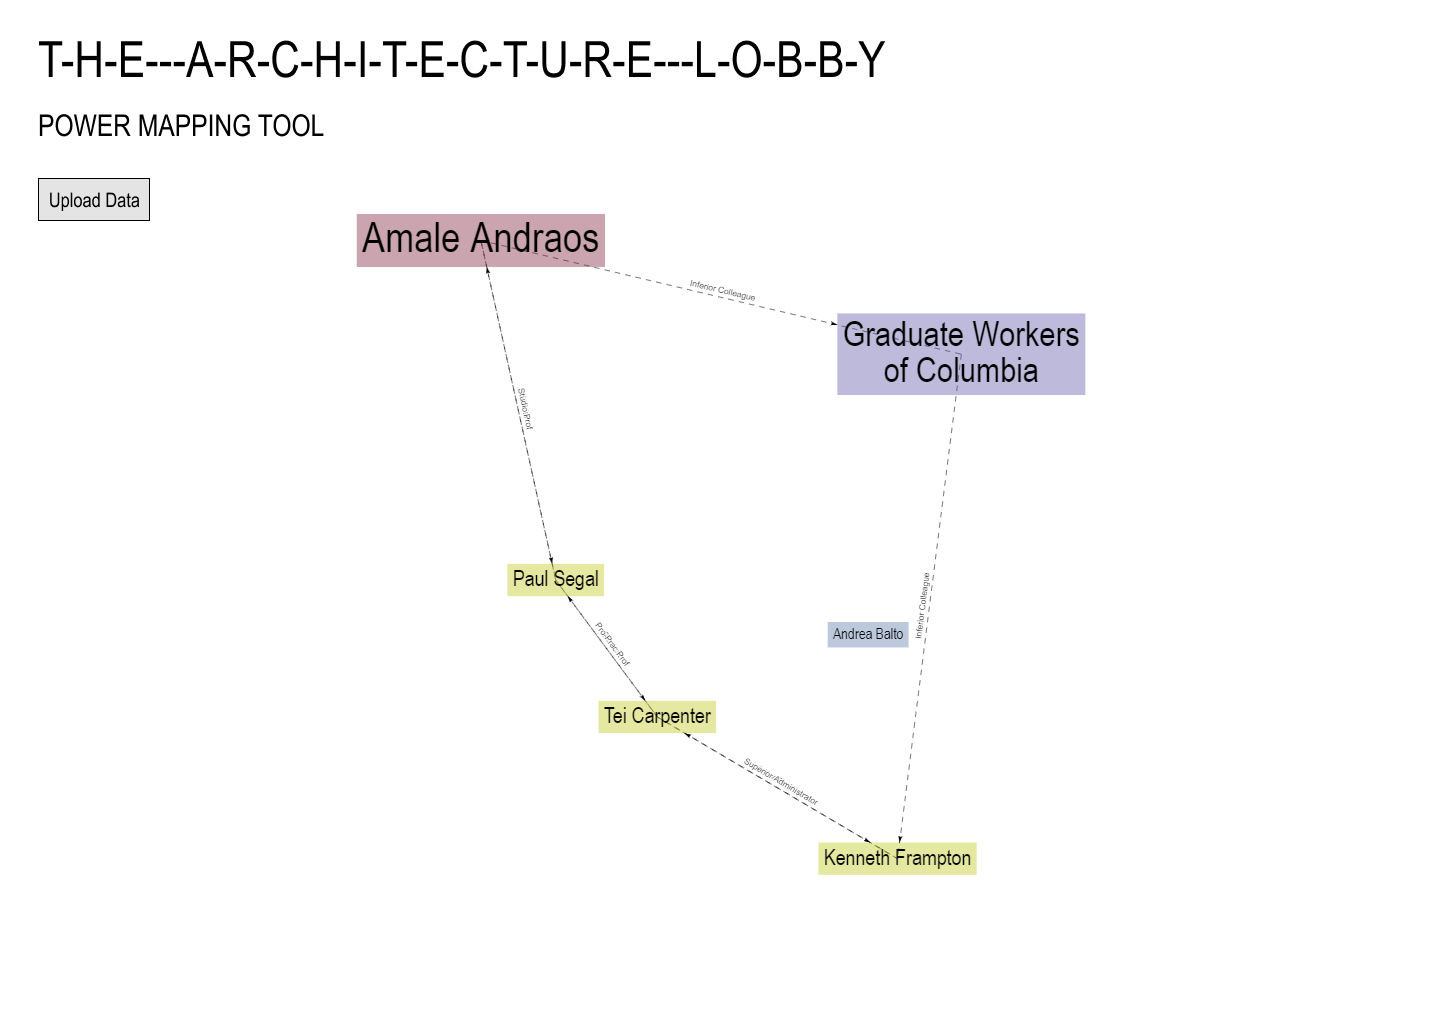
The process we looked to systemize is one that moved from power data stored a sheet format to the a power matrix serving to identify at a glance the relational disposition of the social landscape and to have these data translate into a networked power map highlighting affiliations and connections.
To work through the definition and design of the interface we wanted to build, we needed a more complex scenario, allowing us to iterate through various goals and strategies with a single documented social landscape. We use data from the just transition campaign to model the type of information we were looking to harness through the power mapping system.
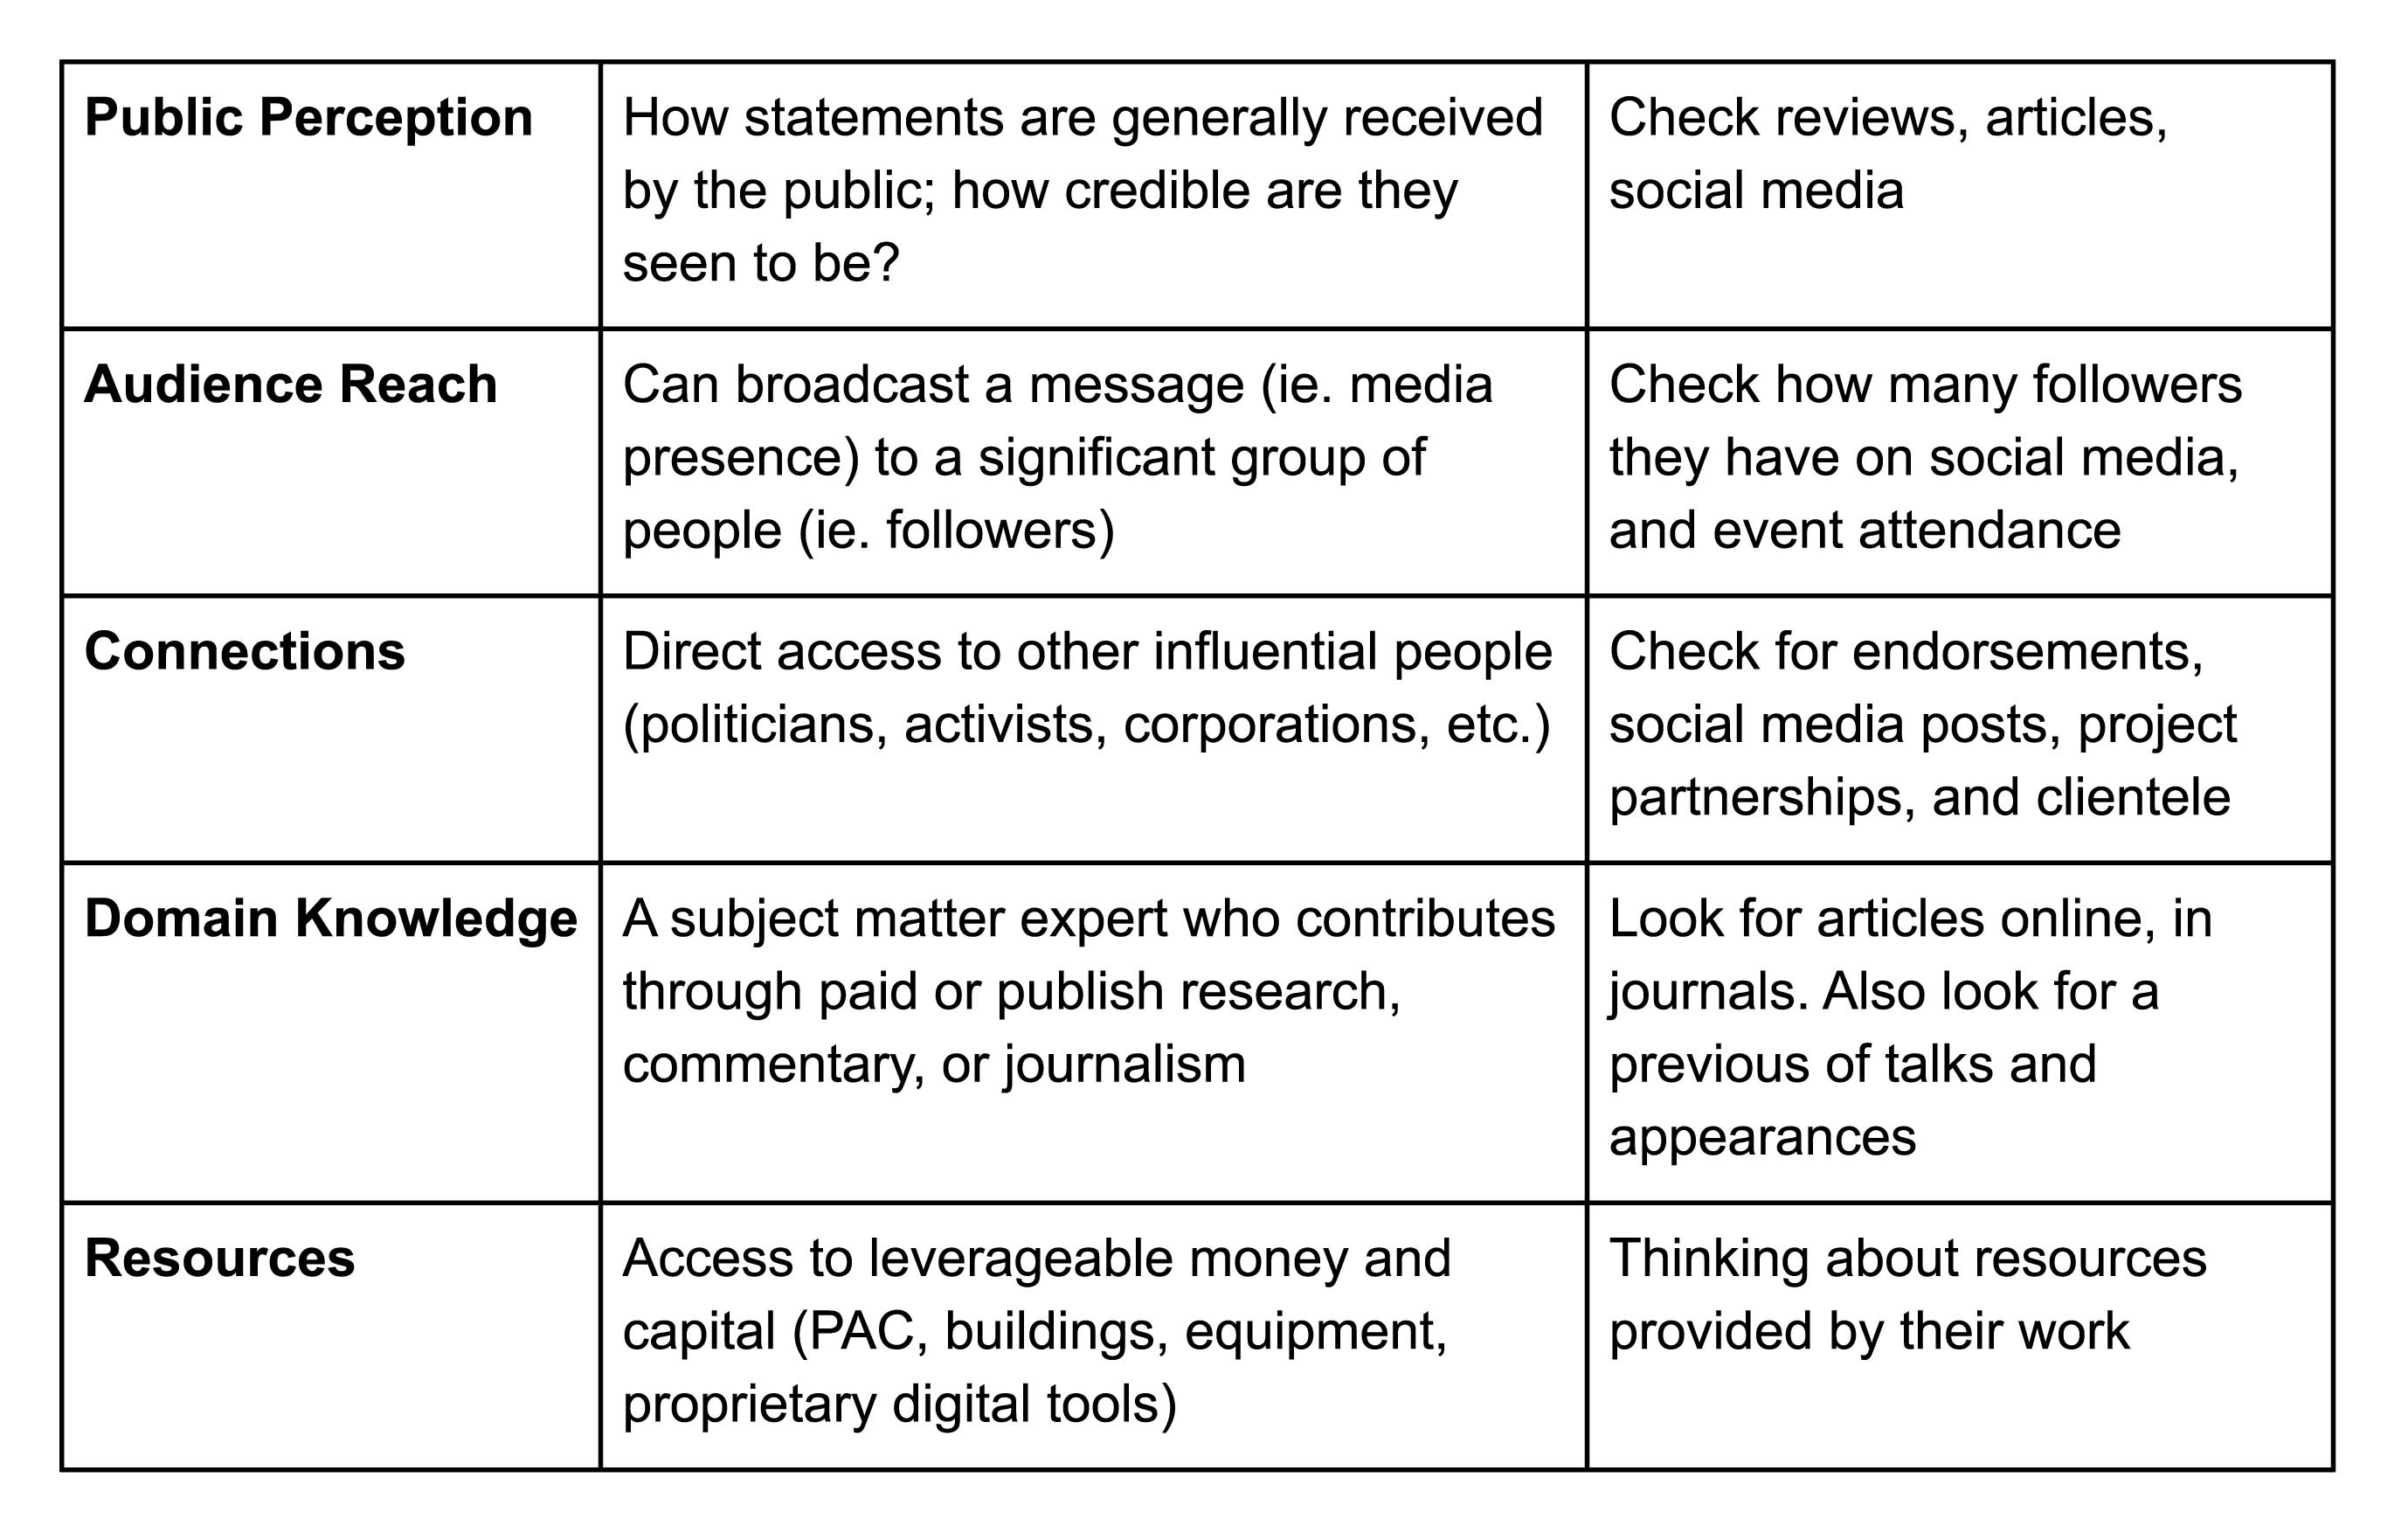
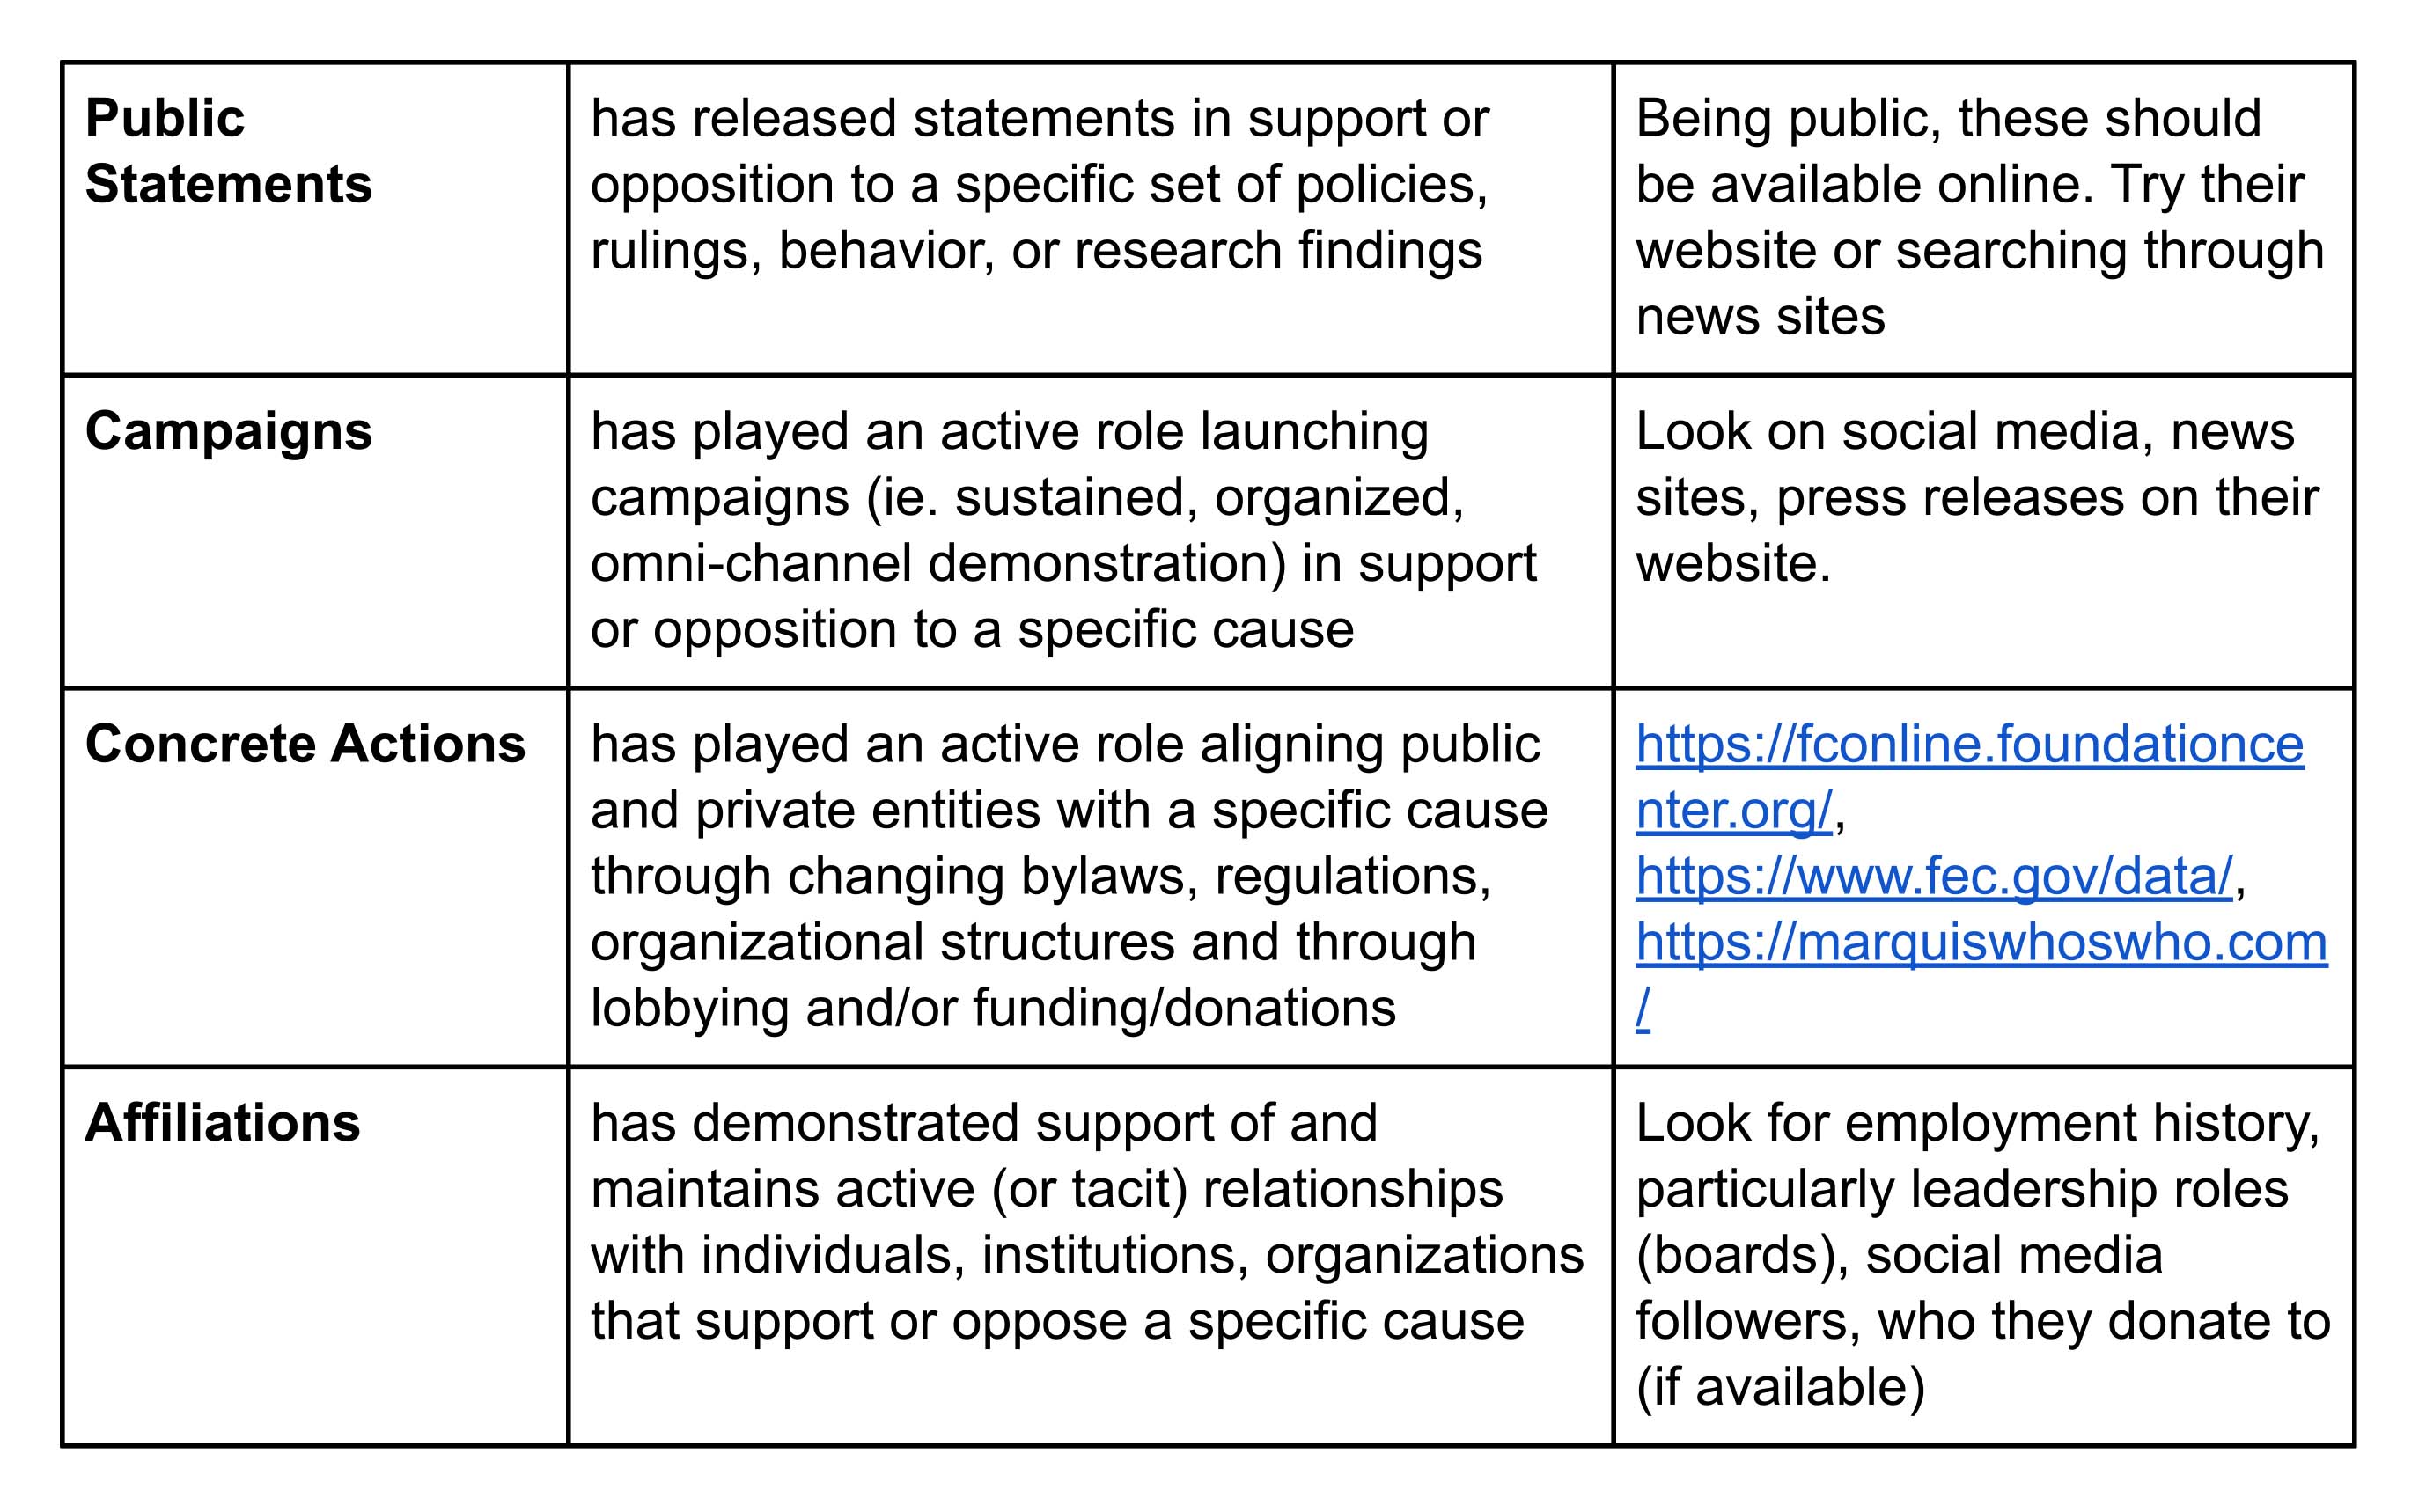
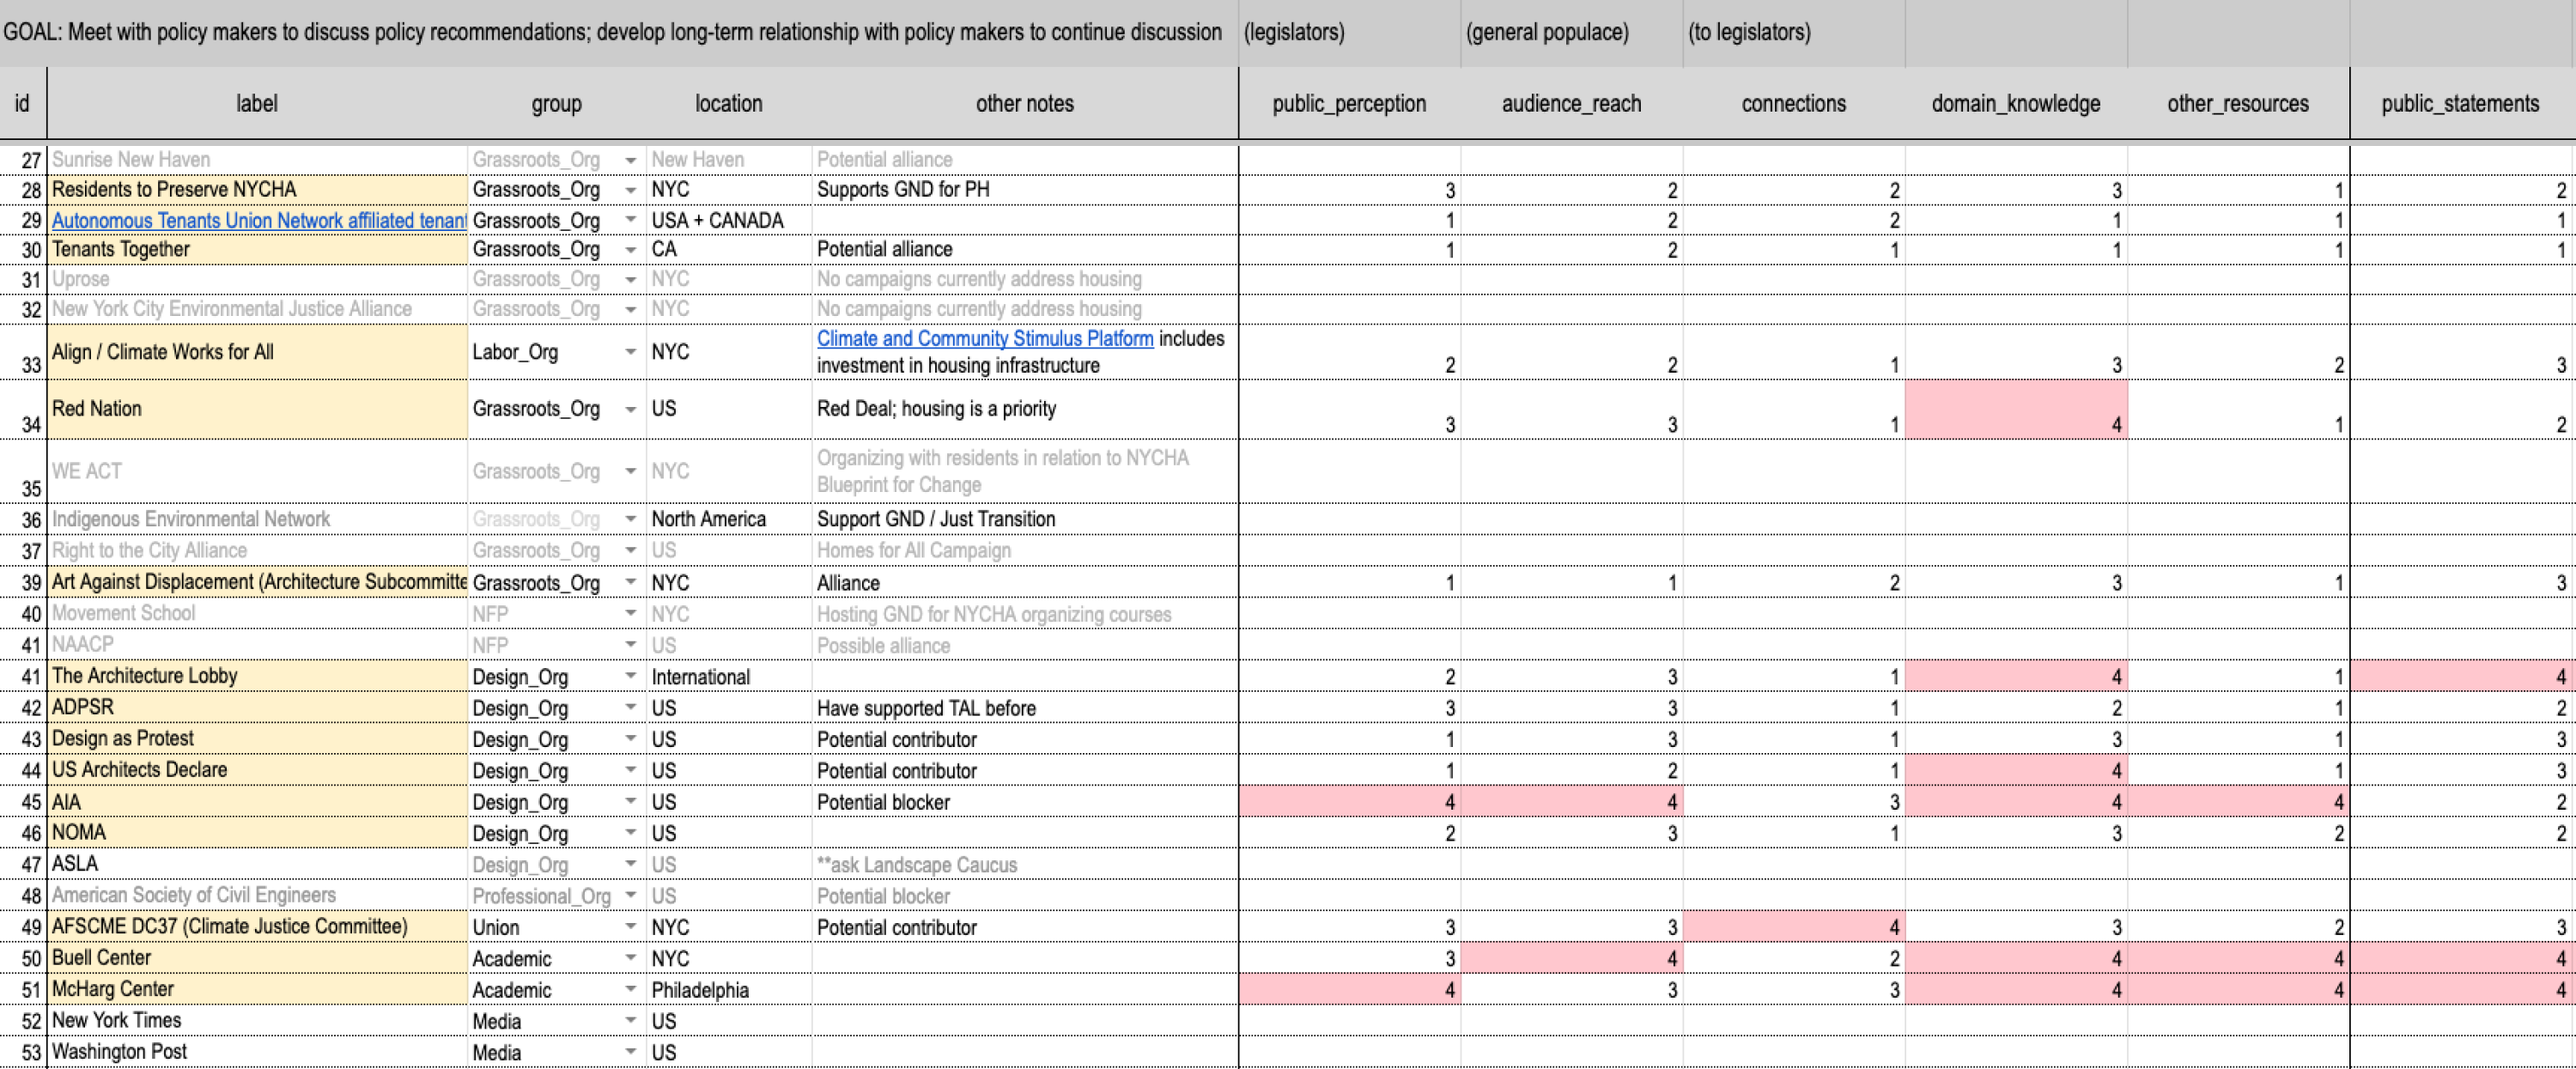
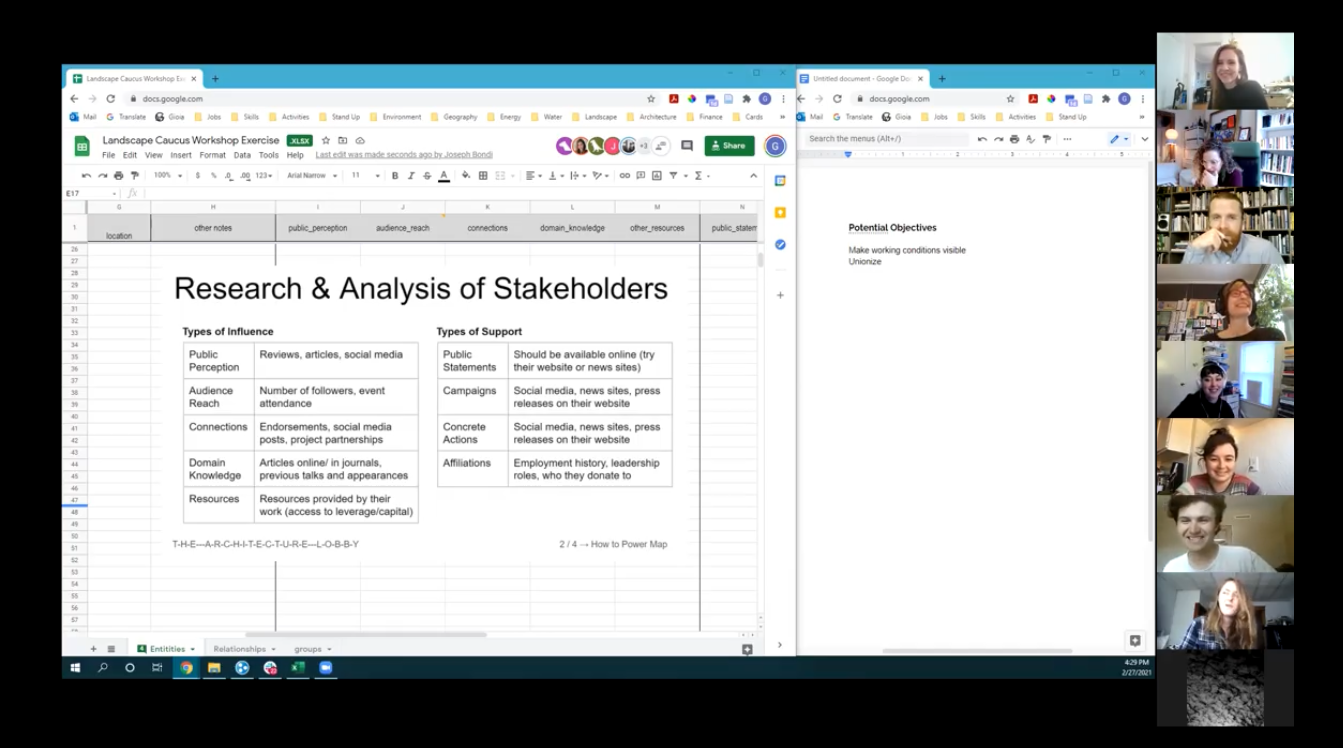
Understanding the different ways that a stakeholder can be influential is just as important as knowing to what degree they are influential. The same applies to their degree of support. Given the history of critical work exploring power structures, there are numerous different ways to classify power (see section on Social Theory of Power in bibliography). We decided to define five types of influence and four types of support to best capture the nuances of influence and support. The two tables below summarize these data points.
These data are compiled onto a intake sheet which displays all sorts of additional actionable information about stakeholders. It constitutes the backbone of the power map, allowing to stockpile data as needed while maintaining the ability to process the data according to new or revised goals.
Visualization tests and dashboard mockups served to incrementally define what our interface could look like.
Frank Burridge took all of our research findings and interface mockups and developed a script using HTML, Javascript, CSS, and drawing on a few JS packages (vis.js, xlsx.js, jquery, and chart.js).
Frank would regularly ask us to test the script with new examples and on different browsers. We corresponded over email to describe in as much as detail as possible the issues we were encountering.
Eventually, the script was good enough for us to make accessible to other members of our organization.
.png)
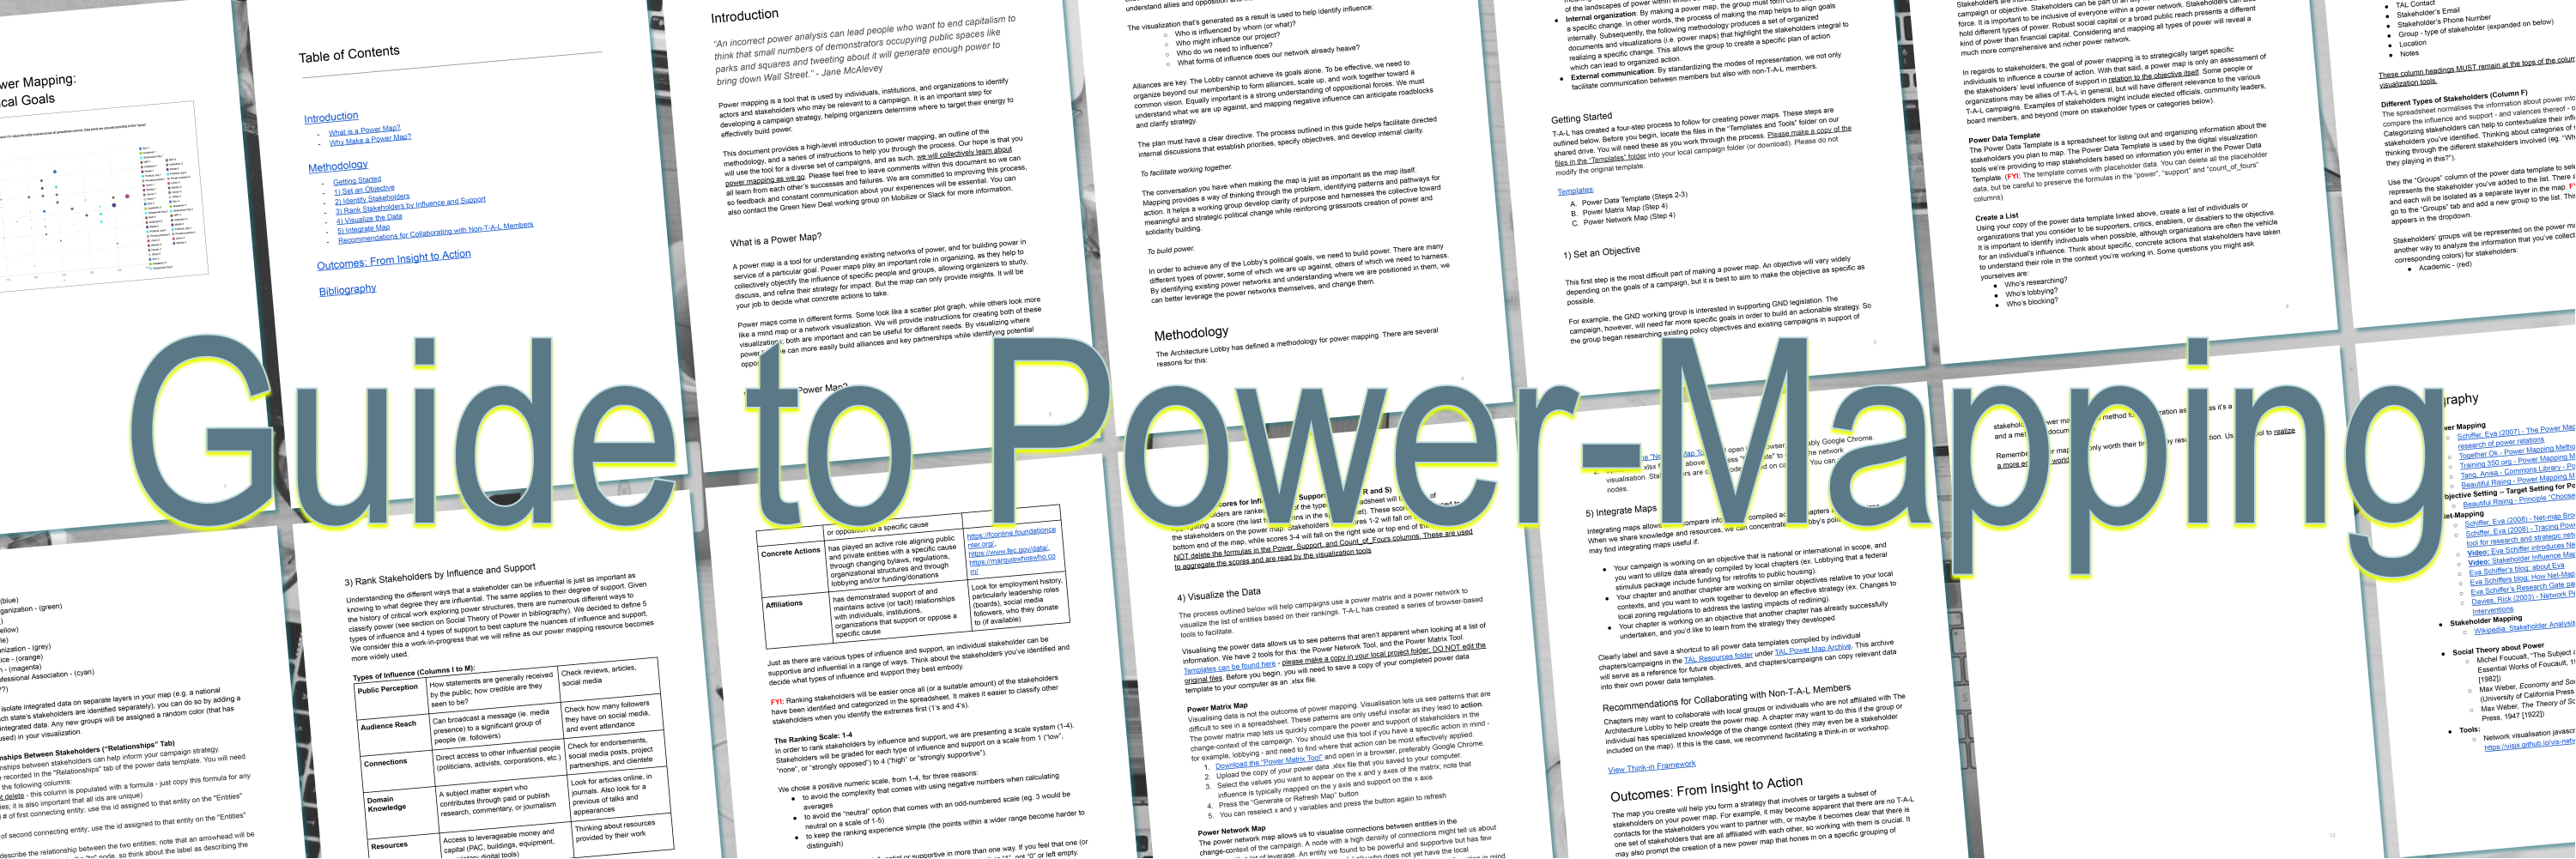
The interface being in its early stage, it required a companion guide to support usage. We wrote summarized our research insights as well as step-by-step guide to creating a database and visualizing it with our script to make it shareable.
To make our methodology widely accessible within our organization, we ran a workshop in which we introduced participants to the process of power-mapping using our guide and script.
These sessions also served to test the usability of the script on users new to the process.
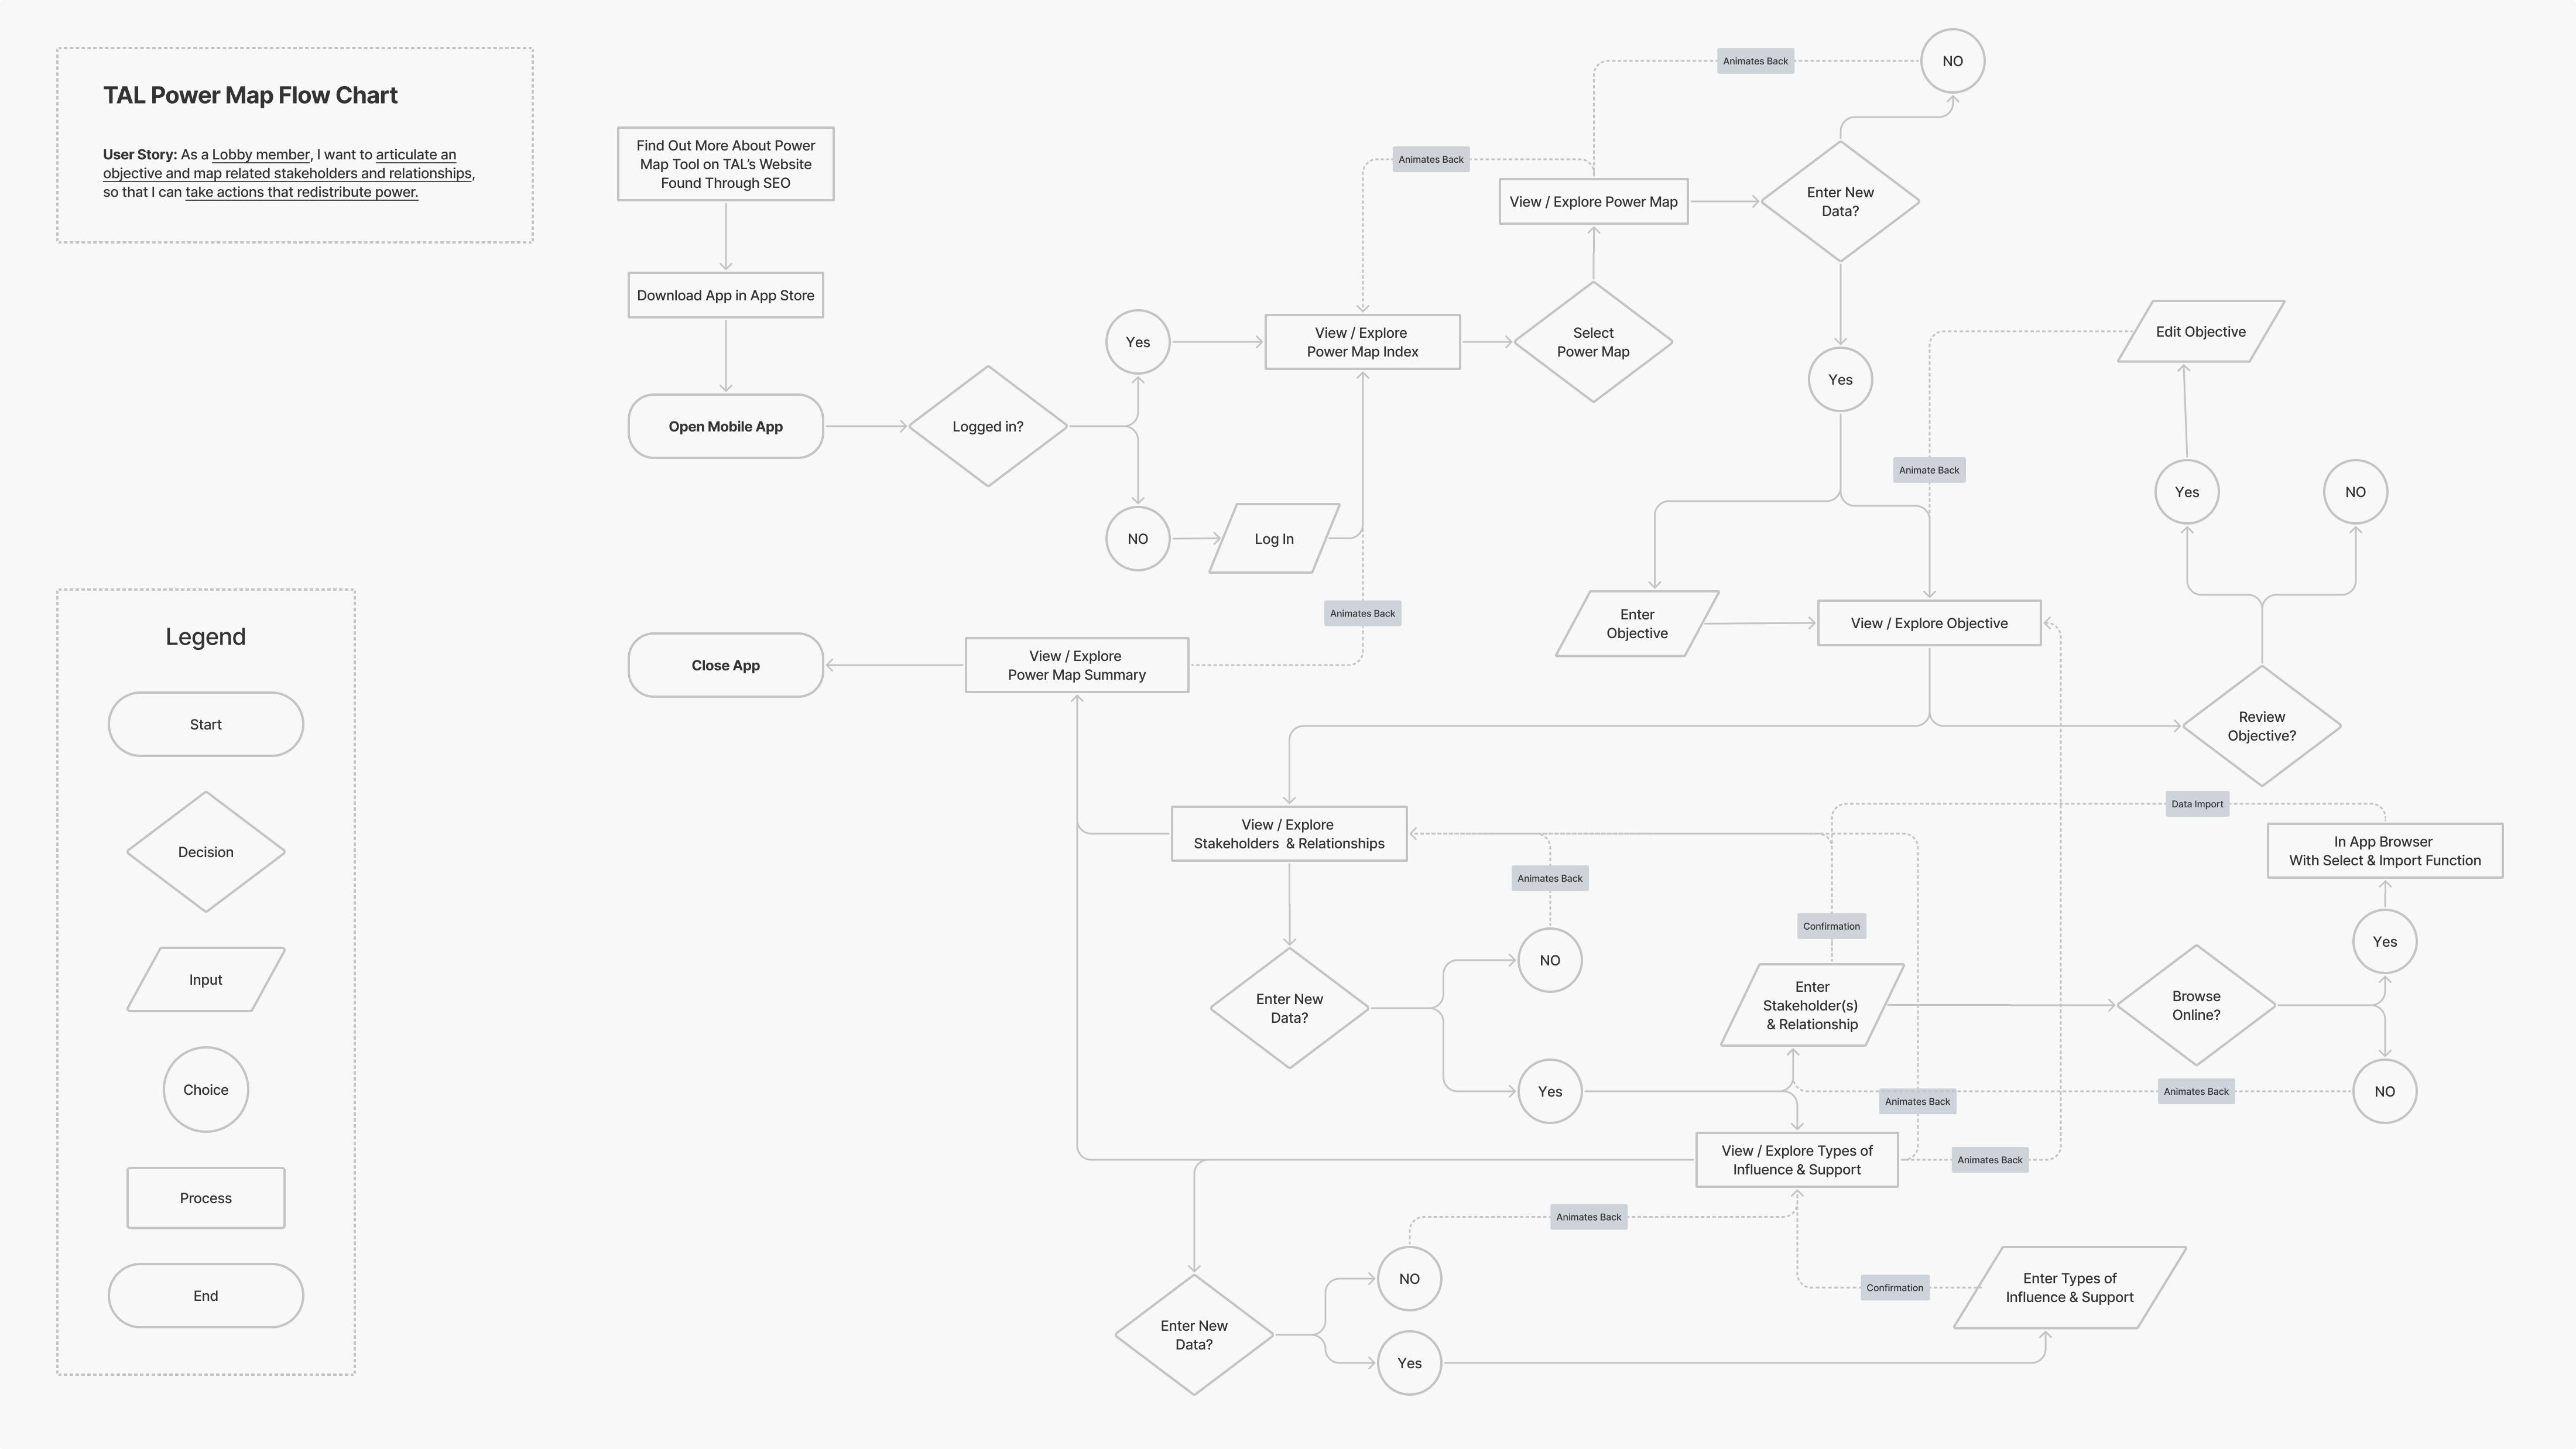
One of the important takeaways was that the transition from Power Matrix to Networked Power Map needed a more continuous ease of use, as this back and forth is key to defining an outreach strategy.
These research insights served to develop blueprints for the next iteration of a the power-map methodology with increased automation and usability.

'Le chêne,' pronounced [leuh-sheh-n' means oak tree in French, my native language.